Highlighting areas of interest in architectural drawings
In the describing of architectural drawings, it is of utmost importance to precisely denote the areas of interest that scholars are talking or writing about. Not rarely a historic drawing contains many important details, for example minute inscriptions, corresponding but different alternatives, glued-on additions and similar features. So far, identifying locations on big drawings (like the one below) was only possible by either carefully the describing the position on the sheet ("lower middle, slightly to the right") or by adding a diagram marking each position with a reference number. Both procedures are error-prone and often bedevilled by misunderstandings and confoundings.
In LINEAMENTA this problem is resolved by graphically highlighting areas of interest in the small preview images ("thumbnails") that are displayed in the top quarter of the online data sheet. All areas in the drawing that are defined by the collaborators are listed below the image ordered according to classification (currently "drawing", "scale" and "inscription" are predefined as area types). When the user moves the mouse cursor over each title line, the corresponding area is highlighted by a transparent red rectangle. This is done with a GIF-Image in which every other pixel is transparent. Experiments have shown that it is also possible to use a PNG image with a semi-transparent alpha channel.
The red shape is positioned on a layer on top of the image and is moved and switched on and off through JavaScript commands embedded in the HTML file. The area coordinates are stored along with each entry in the database and are queried before serving the page (test it here).
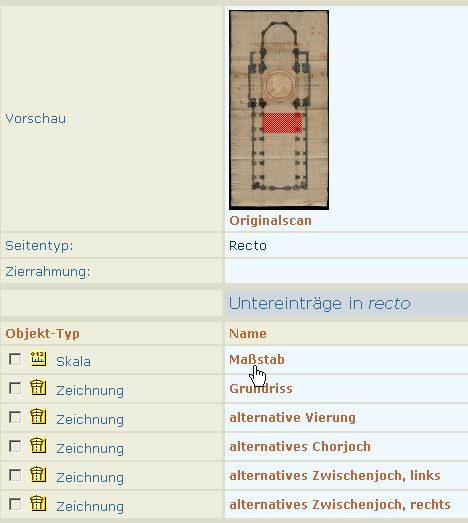
When the researcher clicks on one of the title lines, the data sheet for the corresponding detail is opened in the browser window and additional information is displayed.
Apart from this procedure, the scholar can take another approach to explorer the content of an architectural drawing interactively. Moving the mouse over the image itself will likewise highlight all the areas of interest consecutively. The alogrithm that was chosen here always highlights the area with the smallest surface that is currently under the cursor. In this way it is guaranteed that smaller areas are not completely obscured by larger ones.
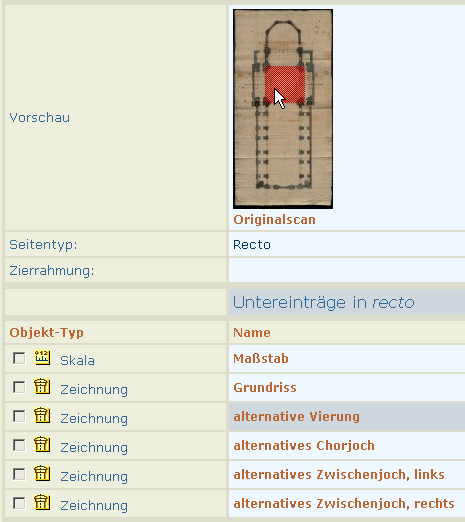
While an area in the small image is highlighted by the user, the corresponding title line is accentuated by a grey background field. When clicking onto the red rectangle, the researcher is taken again directly to the data sheet for the corresponding detail entry. There he or she may consult the pertinent information and/or move on, again by clicking on the image. The image is linked with an URL with a number of special parameters like the following, which contains the coordinates for the area, taken from the database.
http://colosseum.biblhertz.it:8383/digitest/digilib.jsp?
pn=6&fn=&wx=0.3233&wy=0.2850&ww=0.4000&wh=0.1867
A click on it leads directly to the graphic server DIGILIB, which displays the corresponding detail in a high-resoluton image. The DIGILIB interface presents several specialized functions to continue the study of the whole sheet independently.
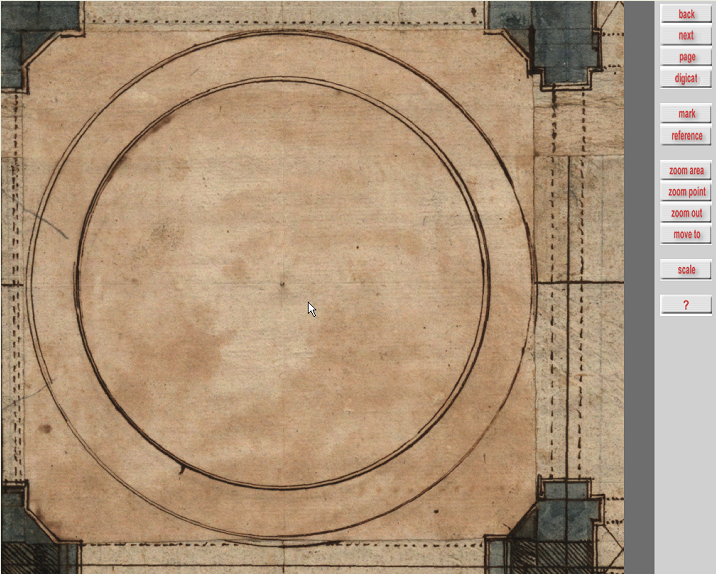
In much the same way as the detail areas are highlighted, they are defined by the scholar who describes the drawing scientifically and enters the data. By dragging the mouse around and clicking on opposite corners a rectangular area is outlined and the relative coordinates are transferred into the database (test it here ). In this way, errors are avoided; if they do happen, they can be found easily and corrected in a moment.